Course: Prometheus | The Complete Hands-On for Monitoring & Alerting udemy.com/course/prometheus-course
Architecture
prometheus pulls metrics
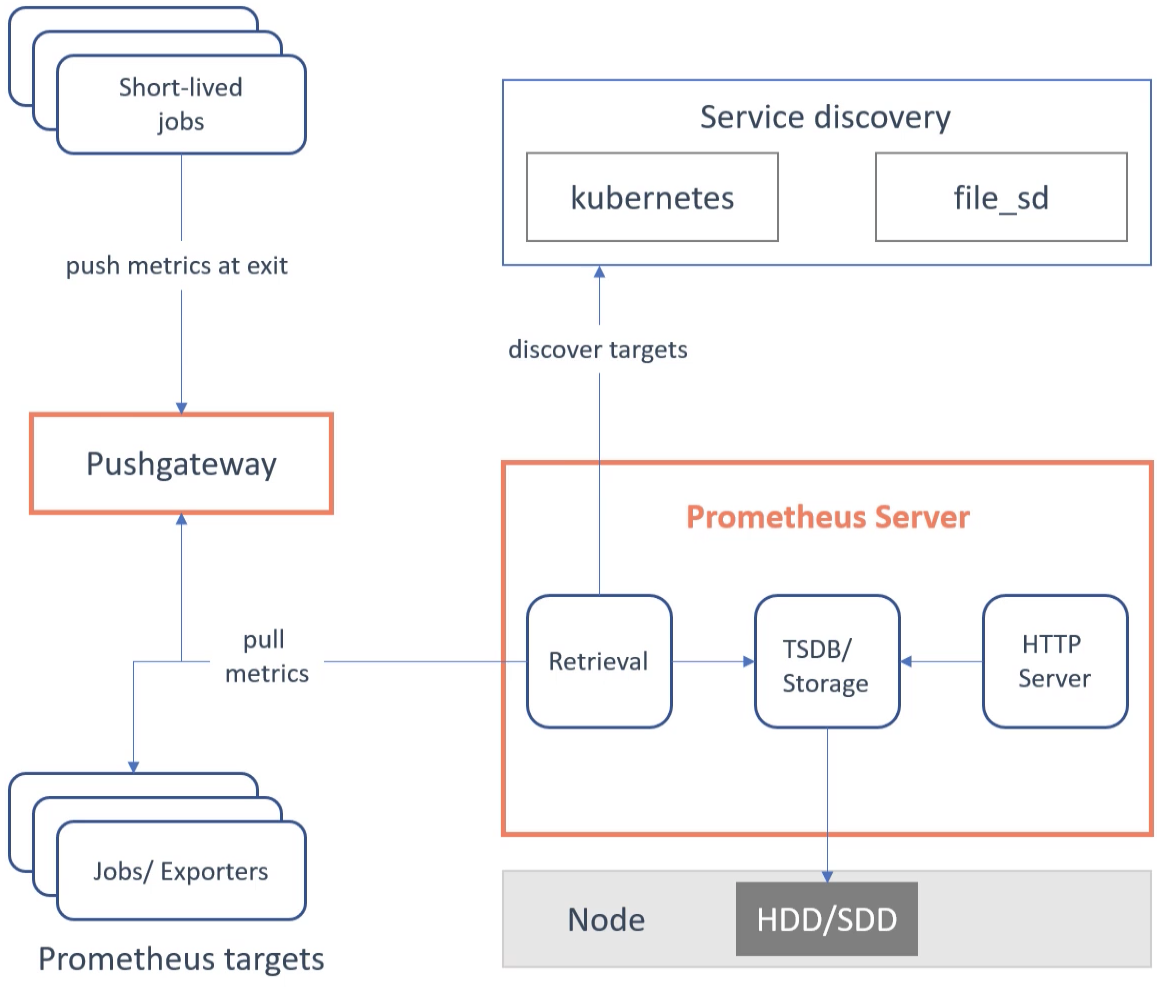
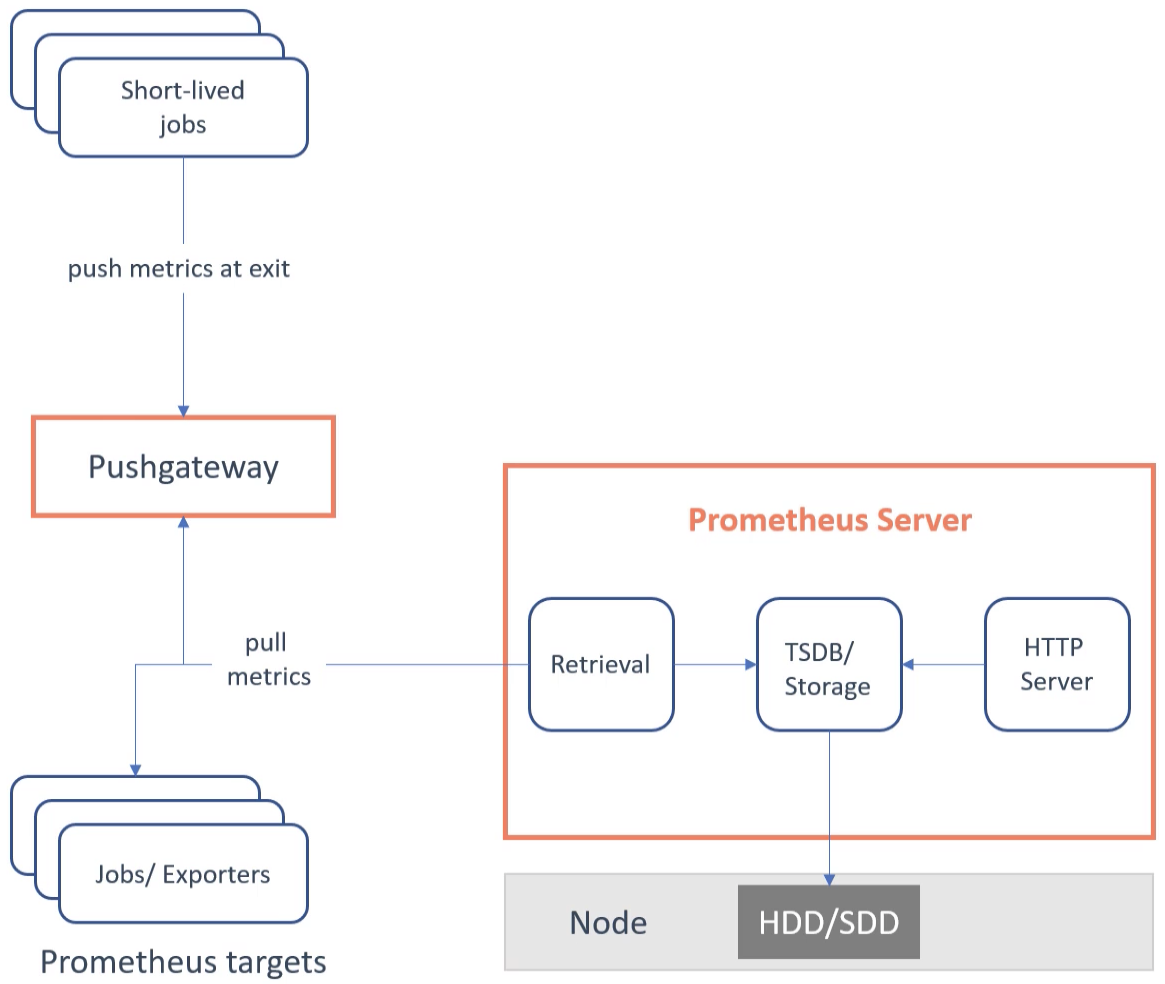 discovery: hardcoded or service discovery
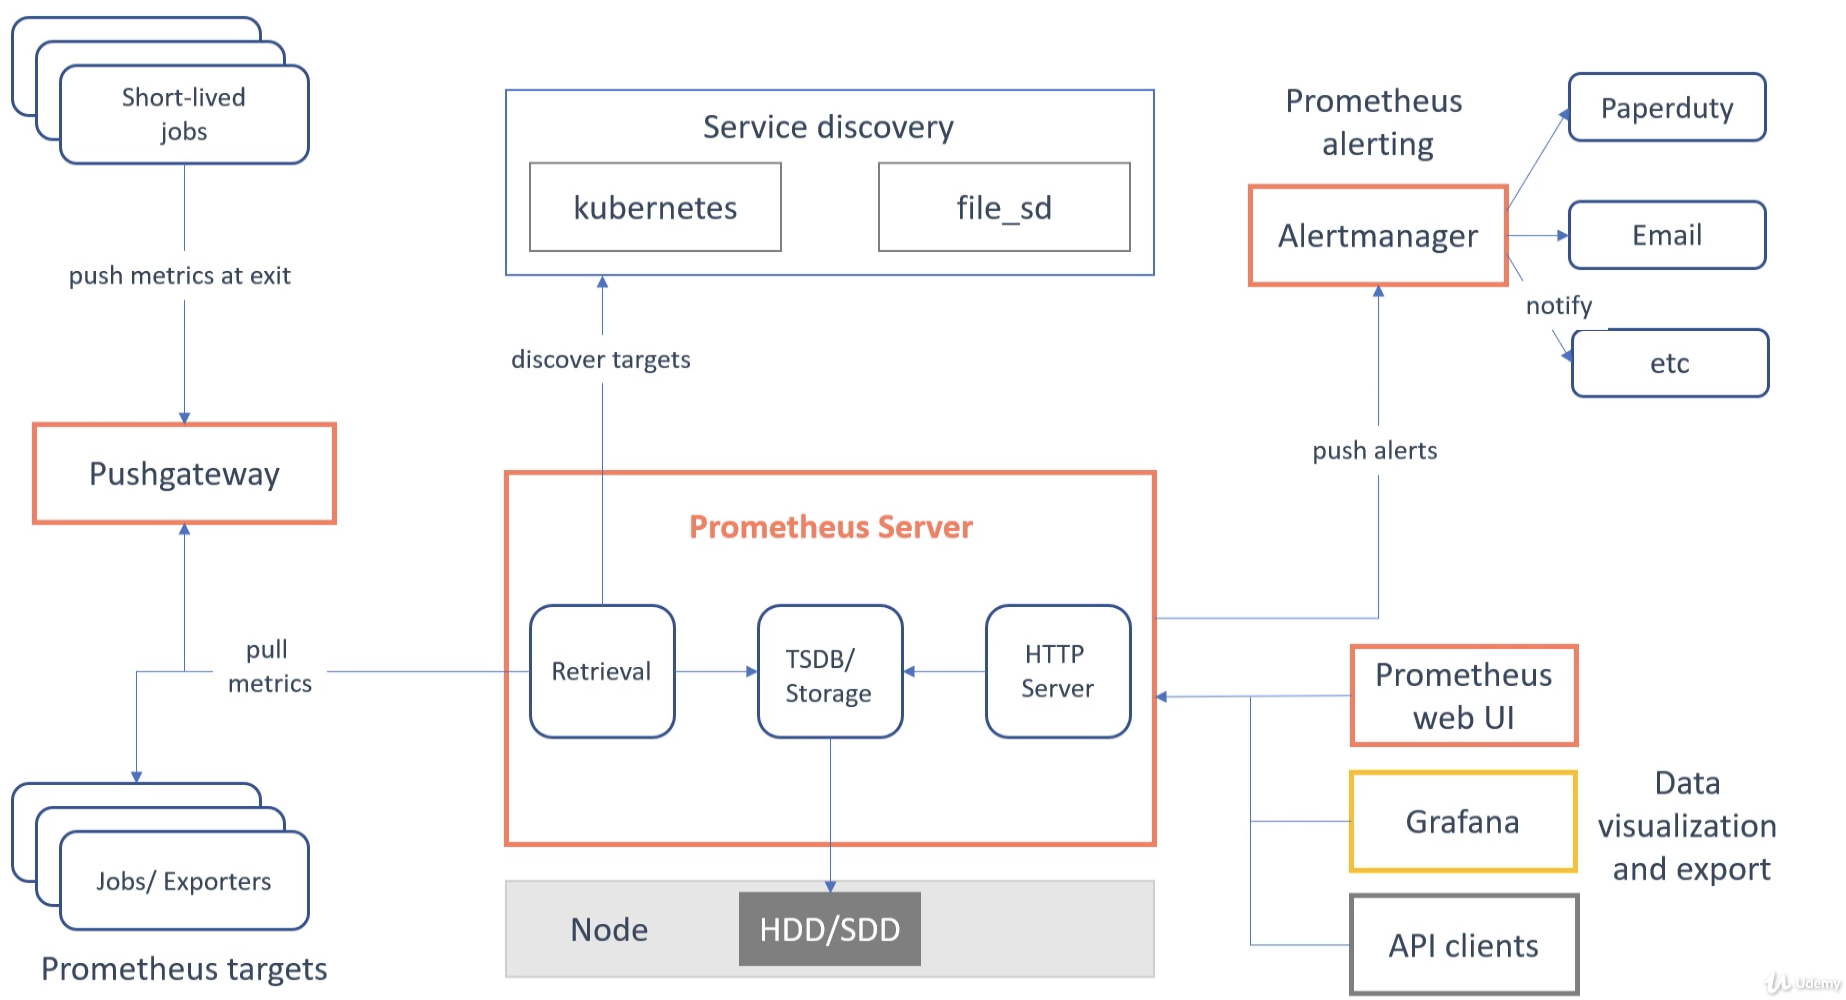
UI
localhost:9090
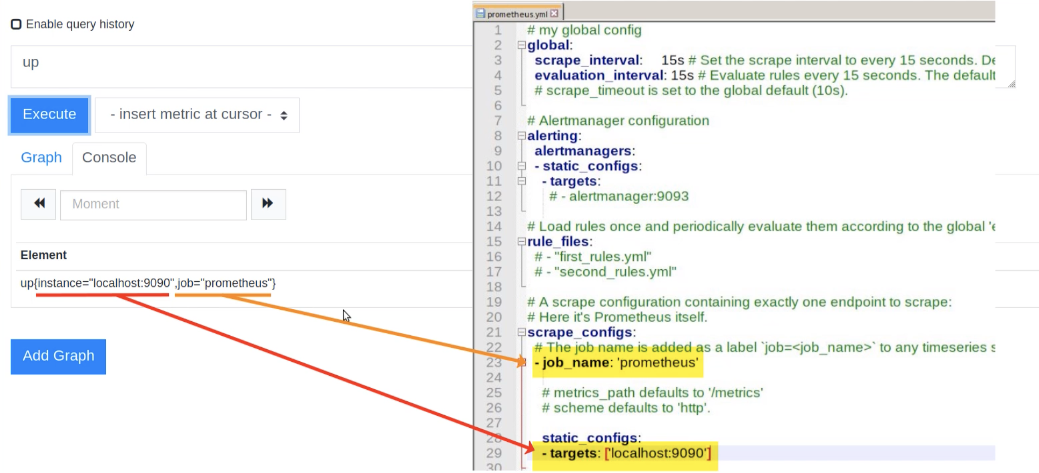
up - targets scraped by prometheus

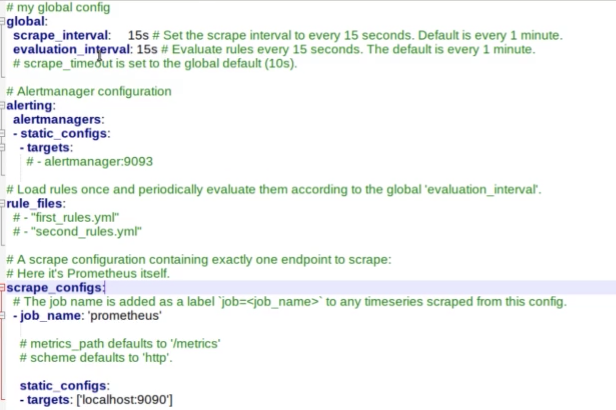
config file
prometheus.yml
 Plain Text
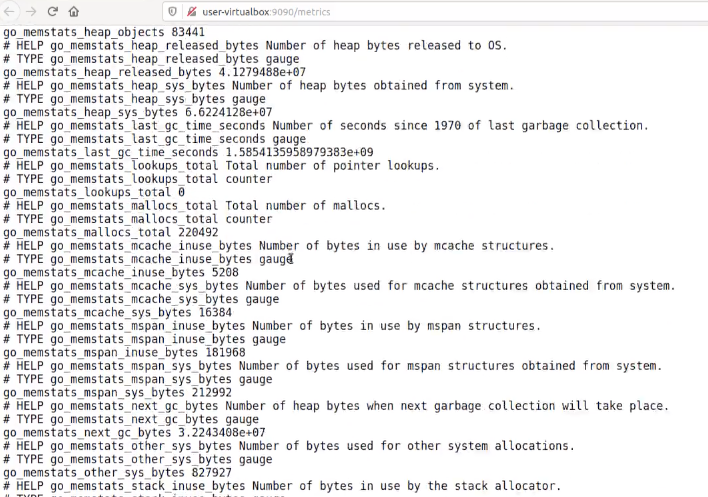
metric_name{key_name=“value”, key=“value”} metric_value
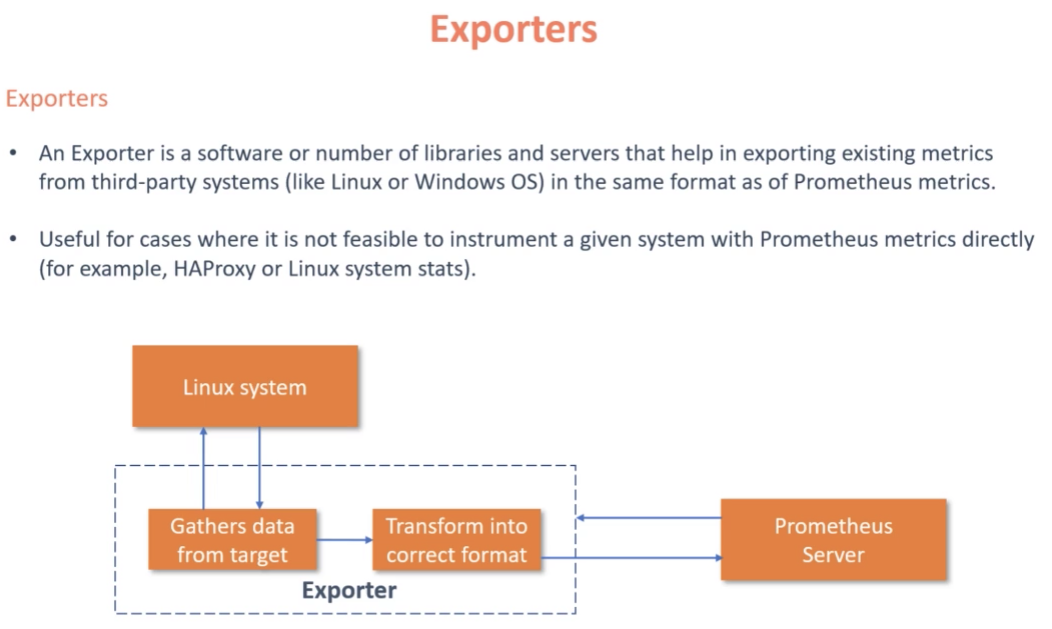
Exporters
get metrics from third-party systems
TODO: PromQL
client libs
prometheus official
 community

metric types
counter - up / restarted service

gauge - up an down
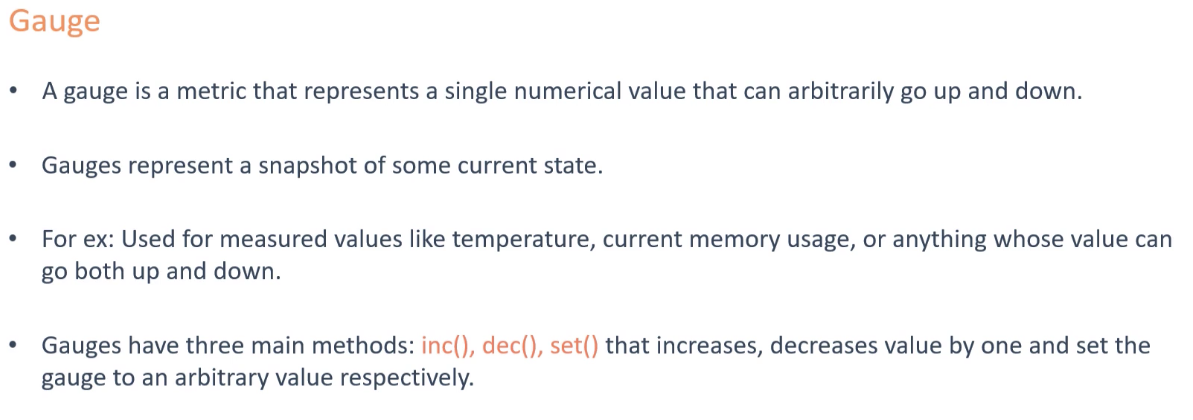


<name>


app_requests_inprogress
summary - samples
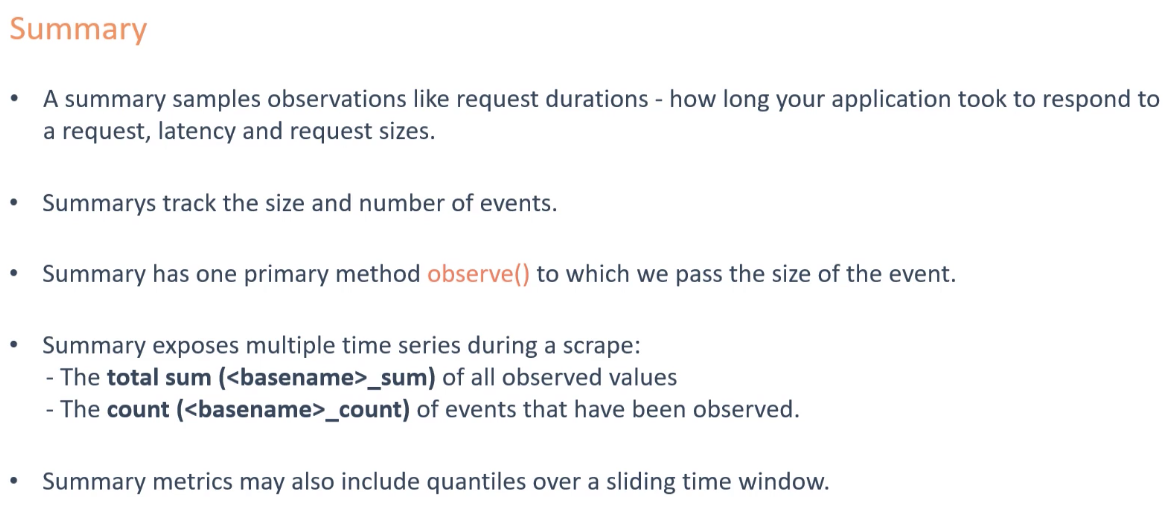

<name>_count
<name>_sum


rate(app_Response_latency_seconds_sum[5m]) / rate(app_Response_latency_seconds_count[5m])
histogram - samples in buckets
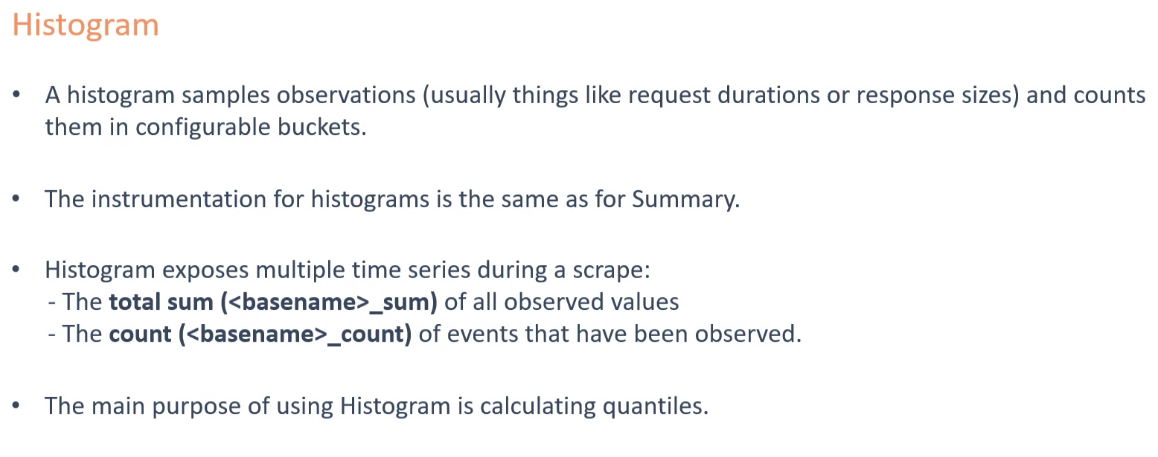
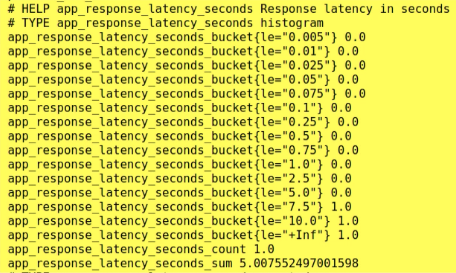
<name>_bucket{le="..."}
<name>_bucket{le="..."}
<name>_bucket{le="..."}
<name>_count
<name>_sum


# le = less then or equal to
# -> every request will be in +Inf bucket
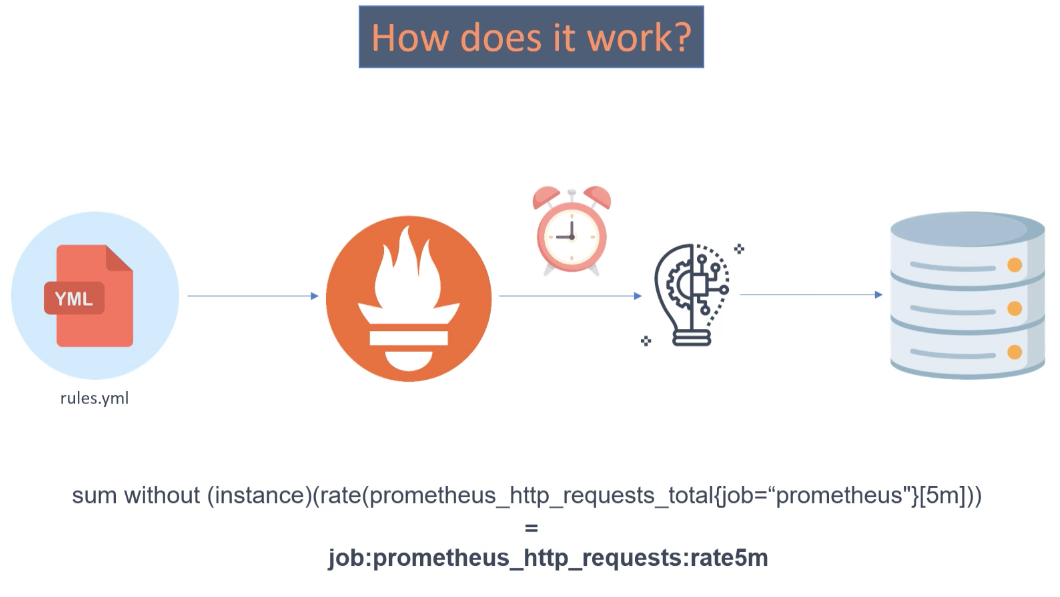
Recording rules
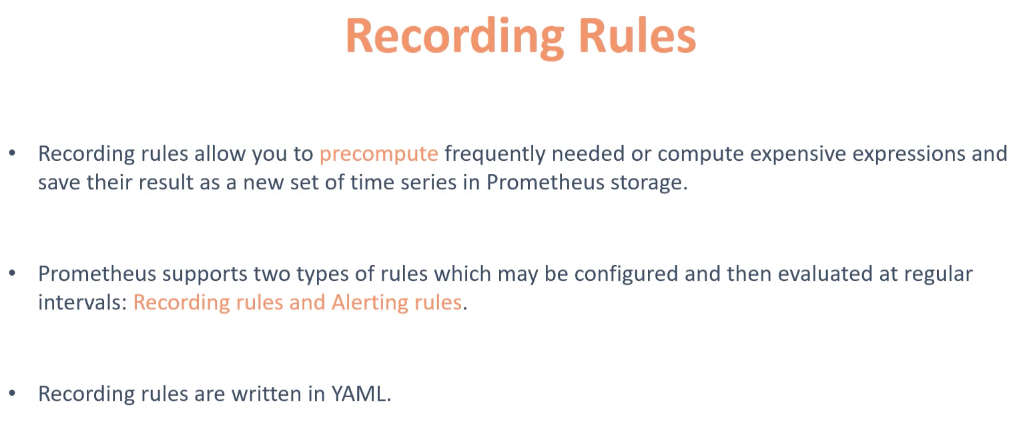 recording rules - pre-cached
stores new time series of the calculated values
